How do you read a heatmap in Leadpages?
A heatmap colors your page based on visitor activity. It's included in the Leadpages Optimize and Scale plans, with no code to install.
The essentials in 30 seconds
- Wait for enough visits
- Turn on heatmap mode
- Read the clicks
- Read the scrolling
- Fix things right away
Avoid: Drawing conclusions from too few visits.
See the details with screenshots ↓Step by step
Screenshots show the interface used in the original guide (Shopify in French, Leadpages in English). In your account, buttons appear in your language.
- 1
Wait for enough visits
Below about 30 visits, there's too little data to draw conclusions.
- 2
Turn on heatmap mode
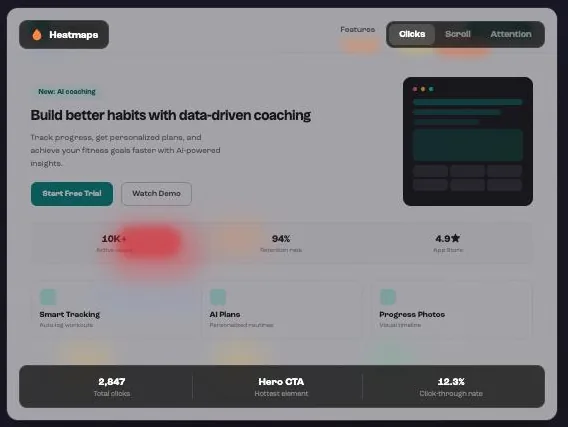
In the page editor, click the flame icon in the toolbar.
- 3
Read the clicks
Red: lots of clicks. Blue: ignored areas. If people click an image that isn't a link, make it one.
- 4
Read the scrolling
The scroll map shows the share of visitors who reach 25, 50, 75 and 100% of the page. If few reach the form, move it up.
- 5
Fix things right away
Edit the page or start an A/B test from the same screen.
Try it yourself
Every HTML Pub and Leadpages plan has a 7-day free trial, with all features.
Try Leadpages for 7 days ↗Affiliate link: it does not change the price for you.
Common mistakes
- Drawing conclusions from too few visits.
- Looking for the attention map on mobile: it only exists on desktop (mobile has clicks and scrolling).
Official sources
Get the next guides
New Leadpages, HTML Pub and Shopify guides by email, every two weeks. No spam, unsubscribe in one click.